

By Morgan Levey
Medill Reports
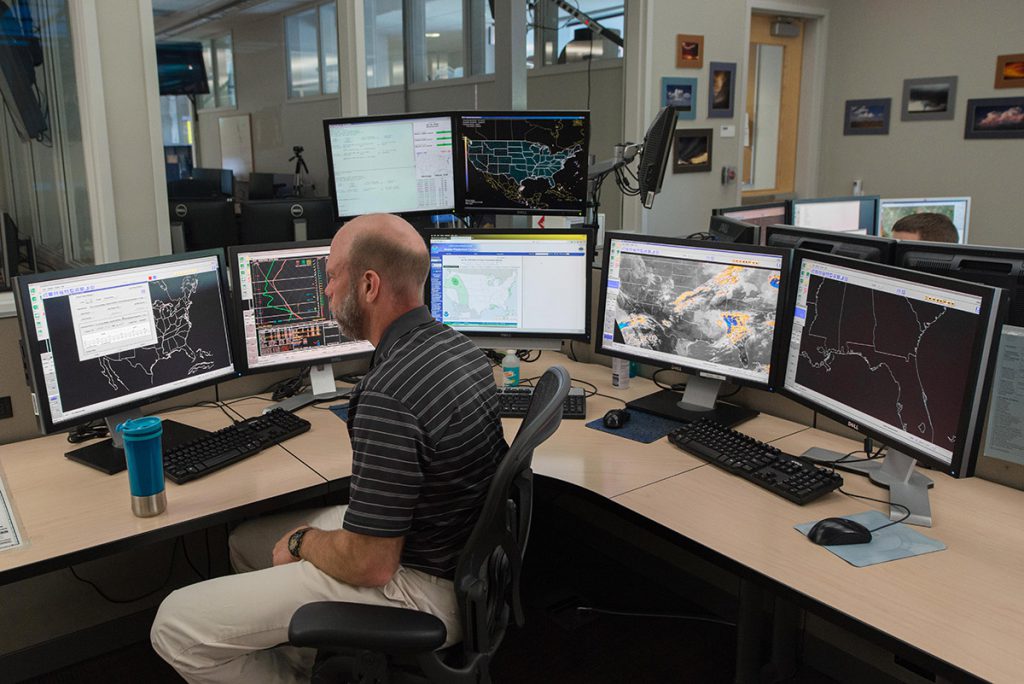
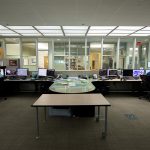
Medill News Service reporter and Comer Scholar Morgan Levey spent two days in the NOAA Storm Prediction Center (SPC) located in the National Weather Center building in Oklahoma. The SPC is responsible for monitoring severe weather — thunderstorms and tornadoes — for the entire country. Staffed around the clock by at least two people, the room contains five main desks with endless computer monitors showing weather maps of the U.S. depicting moisture, wind, radar and a host of other measurements to maximize weather forecasts.
Thursday, April 26: Norman, Oklahoma
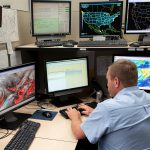
On an average weather day, the Storm Prediction Center is quiet and dim, lit from the glow of computer monitors. I’m in the room observing forecasters work in real time. At the outlook desk, I talk with meteorologists Steve Goss, the outlook forecaster, and Bryan Smith, stationed at one of the two mesoscale desks. Mesoscale is a time scale in the order of which weather systems occur.
“That’s a unique way to chase,” says Goss when I tell him and Smith that I was on NOAA’s P-3 plane flying over the tornadoes in Louisiana the week before. The SPC had received notification that a P-3 plane had spotted a tornado from the air near Shreveport, Louisiana — the plane I was on. Smith remembers seeing the notification and says he found it odd. “That’s the first time I’ve heard of a tornado getting verified by an airplane,” Goss says.
A METEOROLOGIST’S PERSPECTIVE
As the conversation continues, we switch gears to talking about the work they do in the SPC. Forty-thousand people visit the weather center each year, lured by the intrigue of severe weather. And the decisions they make in this room — the Storm Prediction Center — can have drastic consequences on people’s lives. But Goss and Smith say they can’t let the weight of that responsibility affect their decision-making. “We have to kind of stay detached,” they both say, almost in unison.
Goss says that part of their training is to visit an air traffic control unit. Watching all the tiny dots on the radar screen, each one representing an airplane filled with people, Goss was overwhelmed. “And I’m thinking, holy cow, if he screws that up, every single one of those is filled with people.” The air traffic controllers, however, looked like they were playing a video game. “To them, this is just what we do,” he continues.
And after working at the SPC for a while, it’s kind of the same thing. “If you were bogged down and thinking about what’s actually happening when we’re sitting in here in a big day — you kind of have to stay separate from it,” he says.
It’s common across the National Weather Center to be conflicted about major weather. This seven-story building is filled with meteorologists – some of the biggest weather nerds on the planet who happen to be some of the top researchers and forecasters in the field. And severe weather is fascinating to them, though they’re also deeply aware that most people pray for severe weather to stay away. “The really interesting stuff tends to affect people in a very negative way,” Smith says.
“Most of us have an event we remember, or we were close to, or it happened in our area and we saw from the ground what happens. And that made us think, I want to someday be involved with, you know, helping out in that,” Goss says. “But then there’s the fascination from a science perspective that as a nerdy scientist, you’re thinking, oh, this is so interesting.” At this point, Matt Mosier, who’s stationed at the fire forecasting desk behind the outlook desk, stands up and joins the conversation. He says that, for him, it was the Jarrell tornado in 1997, when he was a child, that got him fascinated in severe weather. The Jarrell tornado was one of 20 tornadoes that erupted from a single storm in central Texas. It was one of the fiercest and most destructive F5 tornadoes ever recorded, killing 27 people.
“It was like this traumatic event that literally wiped a subdivision off the map,” Mosier says. While some people — most people — will react to an event like that with anxiety, to him, it’s just fascinating. “So you have this response that’s just, strange,” he says. “For us it was like, well what’s going on?”
And that interest has led to a career of studying severe weather and what causes it. The difference now is that when these meteorologists look up at dark, ominous clouds overhead, they don’t see terror looming. They understand the physical processes occurring, and just shy of bearing down the cone of a tornado, Smith says they’re not scared. “They can’t discriminate a true threat,” says Smith about other people.
Goss agrees. For him, it was a tornado outbreak in 1985 in Pittsburg, an area of the country that rarely sees tornadoes, that got him interested. Seeing the devastating destruction a tornado can cause left a huge impact on him. “To me, it’s like, wow, how in the world can this happen?” Goss says. “And that unanswered question is what ended up driving me into this field, to study it.”
READING THE SCREENS
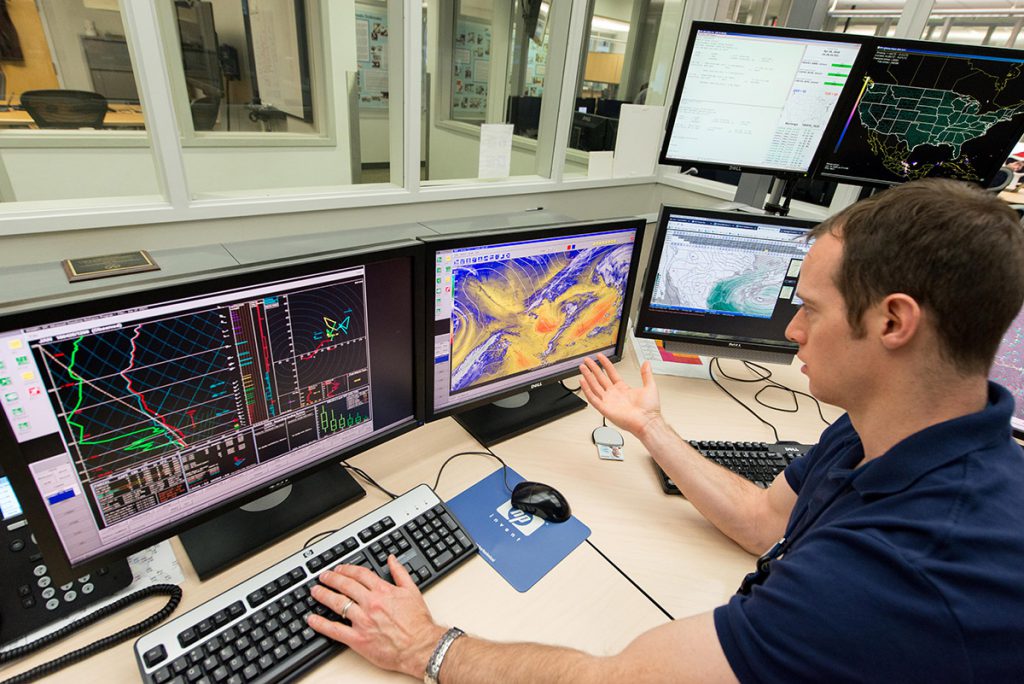
A little later, I spend some time at the desk of Bryan Smith. To show me the workflow process he applies to seemingly endless data, he compares two screens, one with live data from NOAA’s GOES-R weather satellite and the other with a Skew-T, a graph that uses atmospheric measurements captured by a radiosonde attached to a weather balloon to create a vertical profile of the atmosphere along the balloon’s path.
Every day at 0 Z and 12 Z — or 6 a.m. and 6 p.m. CST (the weather service uses Zulu time or Greenwich Mean Time) — the weather service deploys a weather balloon, one of our oldest forecasting tools. The radiosonde attached to the balloon sends information back to the weather center on temperature, moisture, wind speed and atmospheric pressure. The National Weather Service and specifically, the Storm Prediction Center, can use these basic measurements to align their weather models with observational data.
At 11:30 a.m. on this particular morning, Smith points to Jackson, Mississippi, on the satellite map, telling me that the yellow color I’m seeing means the air is dry. He then validates this observation by turning to the Skew-T. At 400 millibars, or 18,000 feet, the lines for temperature and dew point are far apart, meaning the relative humidity is low, only 2 percent in Jackson.
“Two pieces of information that are basically kind of telling you the same thing,” Smith says. “We’ll combine this real-world data and our understanding, in terms of conceptual models of how the atmosphere behaves, with computer model data that goes out in time. And that’s how we kind of make a forecast,” he continues.
This is especially true in the short-term. A forecast for weather three days in the future will be driven entirely by their interpretation of computer models, as there’s no observation data available. But forecasting weather only four hours from now, they can use observational data, the measurements captured by the weather balloon, to extrapolate how the atmosphere will behave using computer models.
”There’s infinite complexity in here, but we just try to simplify it down to a couple of base things,” says Smith, as he looks across his nine monitors.
It’s easier for computer models to forecast farther into the future as the scales get larger. This is due to the butterfly effect and chaos theory — basically, the phenomenon where a minute localized change in a complex system can have large effects elsewhere. An example being, if a butterfly flaps its wings in Mexico the effects can be so exponentially larger that it could cause a hurricane in the Gulf days later. So on a small scale — like a thunderstorm — it’s difficult to predict what the weather will do in just a few hours.
“It’s fluid dynamics. We’re basically fluid-dynamics predictors and our fluid is the atmosphere,” Smith says.
He points to one of the satellite images and asks if I can see the milky stuff on the screen. “That’s actually cirrus clouds. Those are way high up,” he says. Smith then pulls up observational data from the Oklahoma City airport — they’re estimating the clouds to be at 25,000 feet. And at that, we head across the office to the north-facing window.
Staff members of the SPC don’t actually look out the window on an average day to observe cirrus clouds in the sky. But Smith is trying to connect the dots for me. “I’m just trying to connect the data that we see on the screen to what’s actually happening outside in the world,” he says as we both look up.
—
Wednesday April 25: Norman, Oklahoma
Q&A with Bill Bunting, Chief of Forecast Operations at the Storm Prediction Center
My experience with NOAA’s Storm Prediction Center (SPC) began with an interview with Bill Bunting, chief of forecast operations at the SPC, located in the National Weather Center. Essentially, SPC is the hub for thunderstorm and tornado prediction for the entire country. Bunting manages a team of 22 forecasters, men and women who run the five desks in the SPC.
“Our mission is the protection of life and property by issuing severe thunderstorm and tornado forecast and watches,” Bunting says. While his role is about managing successful forecasts today, it’s also forward-looking, focused on planning the strategic vision for the Center and its employees. This incorporates envisioning how the job might change in five or 10 years as new technologies are developed that have the potential to increase storm-warning times for communities on the ground.
I focused our conversation on how forecasts are made and how severe weather forms.


ML: What happens at each of the desks in the SPC?
BB: Well, we have four folks that are on duty at a typical shift at SPC. A lead forecaster — has the ultimate responsibility for every piece of information that leaves this building, this center, during their shift. They also have the responsibility to make the decision to issue a tornado watch or severe thunderstorm watch.
But they’re flanked by two mesoscale meteorologists who essentially help that lead forecaster monitor conditions across the nation. Is the atmosphere behaving as we had expected? Identifying areas that might be needing the forecast to change to reflect different trends. And then to keep the information flow, such that other meteorologists know what we’re thinking, know when watches are coming — we just monitor constantly. Because as I said, the atmosphere can change quickly and that can often have profound effects on the type of storms that we see.
The fourth person is more focused on the longer range. Whereas the three that I just mentioned are primarily looking at today – the next few hours – the fourth position, the outlook forecaster, is often looking ahead to tomorrow. And then after they issue the forecast for tomorrow, they will then come back and update the forecast later this afternoon. So they have sort of a dual role. But everyone else is looking mainly at today and tonight, the first 12 to 24 hours.
ML: How do you make a forecast?
BB: Well, in most cases you will inherit a forecast that someone else has already produced for that time frame. We don’t want to make big changes, because those big changes in the forecast will affect how the message is received. So we start with the basic forecast that we’ve inherited, we talk internally amongst the four or five forecasters that are on duty. There’s often decades of experience on a given shift.
We look at, of course, lots of numerical guidance. We have a really strong emphasis on observational data and this might be unique here at the SPC.
ML: Why is that unique?
BB: Well, say in the case of forecasting rainfall amounts in two or three days, that forecast is largely going to be based on numerical-model output. In severe weather forecasting, say for the next six hours, computer models play an important role, but also important: satellite observations, observations from surface weather stations, radar observations, what’s happening now.
And often those changes that occur in a small area in space and time are very ephemeral — they come together, conditions are right, a dangerous storm could develop, and the conditions change or go away. So it requires constant vigilance and it requires looking for those small-scale details in the observational data in the satellites, radar, surface weather observations to make sure that we see those things before they come together.
ML: Once you’ve inherited a forecast, how far out are you looking to forecast weather?
BB: We certainly look out seven to eight days. It’s usually beyond the state of the science to begin to outlook an area — when we draw on our map areas that we think are at risk — more than about five or six days in most cases. Many things can change in a week’s time.
So certainly within six, maybe seven days, if we start to see conditions becoming more favorable we will begin to talk about areas, highlight them in our maps. But we’ll also talk about the uncertainties. And so that way we gradually ramp up our assessment of the threat and gradually get more specific in terms of what areas are most likely to be affected. How bad will the storms be, will they be hailstorms, windstorms, tornadic or some combination of those? And then as we get, certainly within the day before or the day of, we’re really trying to hone down those details and be as specific as possible in our forecasts and other information that we issue to the public.
ML: So it’s just a constant refinement process that happens?
BB: Yes, it’s definitely incremental. Now every once in a while, something changes — you have to make drastic changes to the forecast. And of course, we’ll do that.
A common example, and this occurs often in the summer, is when you’ve got lots of storms over many areas. And in some cases a day that you might think has really high-end potential for severe storms, overnight storms in the same area occur. The air becomes cooler, more stable, there’s cloud cover. It may not reach its full potential later. That happens fairly frequently. So again, it comes back to the notion of constant vigilance and trying to figure out what the current conditions are like, how that will affect storms several hours into the future.
ML: Why does the tornado season change, geographically?
BB: One of the main reasons, it has to do with the steady northward progression of solar heating as we move through the seasons, so as the heating begins to lift northward during the spring and eventually the summer, the strongest winds in the atmosphere — and the jet stream is directly a result of the temperature difference between the poles and the equator — as that shifts northward, so does the tornado threat.
And so in the winter, it’s primarily across the southeast U.S. — Florida. You can have episodes of tornadoes in other areas, but typically it’s in that region. And then as the jet stream shifts northward as we move into the spring and early part of the summer the tornado season shifts northward as well.
ML: A basic question — what are the main components that are needed to make a thunderstorm?
BB: A thunderstorm needs three ingredients. It needs instability in the atmosphere, so as the air rises it continues to rise because it’s warmer than the surrounding air; we need moisture, which is the fuel for that instability; and we need a lifting mechanism, a cold front, a warm front. It could even be a mountain — terrain can actually force air to rise up. If those three ingredients are in place, we can get a thunderstorm. Fairly simple.
ML: And then from that, what needs to happen for it to become a tornado?
BB: First we need strong wind fields throughout a deep layer of the atmosphere, certainly from the surface to 25 — 30,000 feet. That helps to organize the storm, it helps to develop rotation, not the tornadic rotation, but the rotating updraft that is what defines a supercell.
If you get those ingredients in place, you can get large hail and damaging winds, but then you need to really strong wind fields near the surface, lowest one or 2,000 feet. That can often be what makes the difference between a non-tornadic supercell and one that has a really dangerous tornado risk.
ML: And how do you forecast a tornado?
BB: First of all most tornadoes form from supercell thunderstorms. So a big part of our challenge is forecasting environments that are favorable for supercells.
Once we think supercells are possible, then it comes down to what percentage of those will produce tornadoes. It’s usually 10 or 20 percent. What we look for are unstable atmosphere conditions with strong windshear [a difference in wind speed and/or direction over a relatively short distance in the atmosphere] throughout a deep layer. But then especially windshear that’s changing wind speed and direction with heights [elevations] in the lowest one or 2,000 feet can often play a big difference. You combine that with relatively low cloud-base heights, because the air is very humid, and it can create really dangerous conditions. And then assuming the storm stay fairly isolated, that can be a recipe for real trouble.
Sometimes you can have tornadic storms that are in like a squall line, or in some other type of configuration. Those tend not to be quite as strong, but they can still do damage. And so it’s really quite a spectrum of conditions that can lead to the development of a tornado.
ML: Why do isolated storms have more potential to be severe?
BB: Isolated storms tend to have less destructive interference from nearby storms — cool outflow, they can shoot out from an adjacent storm and disrupt the inflow. And so when you have more competition for that unstable air, it can often lower the overall intensity of the storms, not always, but often. We say very few absolute things in meteorology. But typically the more isolated storm in a favorable environment is probably potentially more dangerous.
ML: Oklahoma has been in a drought. How does that impact severe weather at this time of year?
BB: Well, certainly the pattern that we’ve been in most of this winter and spring has been such that we get these periodic cold fronts that move through. Cooler air, more stable air — as those fronts move into the Gulf of Mexico it makes it more difficult for that warm, moist air to begin to return back northward. And so it somewhat decreases the probability of a tornado.
Now as we get later into the spring, those cold fronts become less frequent, warmer. We don’t get the Arctic air it’s more of a modified air mass. And so the influences of those cold fronts become less and less. Eventually, it will get warm. It will potentially get more humid and we’ll have to be concerned about the tornado risk. But some years, and in 2018 is one of those years, where the predominant weather pattern has tended not to favor many occurrences of tornadoes across the U.S. — really in any area. The areas that have been most affected so far, the southeast and parts of the Tennessee and Ohio Valley.
ML: How are social sciences now playing a role in forecasting now and how you communicate forecasts?
BB: I think it’s always played some role, but clearly in the past 10 years, maybe even five, we have gone from I think sort of a basic understanding of how to communicate things like probability, uncertainty, to really getting into the specifics about how you communicate risk information in many different forms, to many different groups of people. You know, we communicate primarily through graphics and through text, but we tend to write for other meteorologists who then convey that to the public.
But if a citizen came to our webpage, they would need to know how to interpret the essence of it. And so we’ve actually gotten better, I think in providing more publicly focused summaries. It’s also clear to us that numbers, maybe even icons, colors will become more central to communicating risk and not just text and basic graphics.
So that’s just a hint of some of the societal impacts information that we’re looking at — how people behave when they receive our watches, local-office warnings. How much lead time is optimum? How often should warnings be updated? How will some of our new paradigms that we’re envisioning for conveying information, how will that affect decision making? We have many questions — we have some answers, but fortunately, we have some really talented social scientists that are helping us to navigate those questions.
ML: What does the future look like for storm prediction? What are the goals?
BB: Well, I think we have quite a few goals. But the one that I think is most important is to increase the flow of information, in the general sense, for all hazards. Right now, we tend to issue information at fairly discrete intervals as a severe weather event, say, approaches. The same is true for a winter storm or even a hurricane. By increasing the flow of information and by making it more and more probabilistic, then I think people who have different decision thresholds can make those decisions when it’s appropriate for them.
Say, they have a hospital and they have to move patients to an interior room on the lower floor — that takes time. And right now, most tornado warnings have somewhere in the 10- to 15-minute timeframe, for lead time. So if you’re a hospital administrator, you need more time. Well, the probabilistic flow of information updated frequently could help you make that decision earlier when you need to begin taking action.
Another goal is just to get more specific about that information. It’s one thing to say, there’s a risk of severe storms in central Oklahoma today. But if we could say, but that threat is really between 6 and 8 p.m., then from a planning perspective that’s much more actionable information than just saying there’s a threat today or tonight. We can do that, but I think we can do that better and through information distribution channels that could be used on a smartphone, with an app or some other format. It just makes it easier for people to get this information and to act on it.
So lots of goals, but it really boils down to increasing lead time, decreasing the false alarm, and providing information in a manner that allows many different people with growing information needs to monitor that information and to use it effectively.
