
DigitalGlobe maps the Earth’s surface at a high resolution, to the extent where you can take a single map and zoom in enough to clearly see the windshield of a car, though the bobble head on your dashboard is safe from view so far. The company works with mineral prospectors, city planners, tech companies and different branches of the federal government. It also provides free imagery to journalists and scientists, such as helping the Associated Press locate slave fishing ships exchanging their catches with vessels that sell to major U.S. grocers. Medill News Service reporter and Comer Scholar Austin Keating is an embedded reporter with DigitalGlobe this spring, learning how to find pin-pricks of changes on the Earth, such as an elusive sinkhole in Siberia that opened up on herders who almost fell in.
By Austin Keating
Medill Reports
April 30, 2018, Westminster, Colorado. When printed on paper, an image and a map aren’t all that different. Each is as static as the other, prevented from nesting extra layers of perspective and impact that their interactive, digital counterparts can wield.
What I’ve learned over the past three weeks on a reporting embed with DigitalGlobe is that the digital realms of maps and photos are vastly different. They branch off from each other as ever-elusive “media,” and pick up specialized and unique capabilities.
So now a question: Is this a map or a photo?
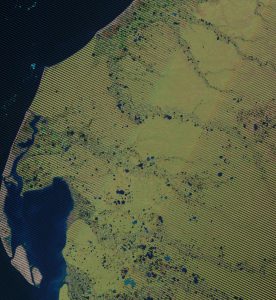
While you might be tempted to call this a photo, it’s really a map. It was lifted from the U.S. government’s open satellite database EarthExplorer, and almost every pixel has a set of coordinates. You can open it in the mapping software ArcGIS and the photo-editing software Photoshop, but it gains more utility in ArcGIS because you can search any set of coordinates — to find an elusive sinkhole in Siberia or a collapsed mine in West Virginia — and find it instantly.
DigitalGlobe is a mapping company the federal government allows to map the Earth at up 30 cm resolution, and as such, provide some of the highest resolution, commercially available maps on the market. Their constellation of five satellites of varying age and capability record reflected rays of light from the surface 24/7 for maps.
I spent the better part of a day on Monday poring over less high resolution, old government imagery, trying to tease out when a sinkhole — caused by thawing frozen soil called permafrost — first opened. Satellites brush over the planet like an army of disembodied paint brushes and rollers. But by searching for specific pin-pricks and coordinates on the Earth’s surface, I narrowed-down the hunt to a couple thousand archive maps taken over a decade of public science satellites passing overhead.
In those images, I eventually found one that wasn’t obscured by clouds and uncovered that the sinkhole first busted open in 2014, near the time scientists first observed it in a published photo. I was able to take coordinate metadata from that to start my search. But now I’m using a more specific date I gleaned through the old satellite data to gather higher resolution satellite imagery of the same spot recorded by DigitalGlobe. The end product will be a timelapse that you could call an animated photo, or gif, but since it couldn’t happen without embedded geoinformation, it will be an animated map.
I came here with experience making simple geocoded maps, ones that are no more complicated than assigning one of five colors to a hundred counties, known as a choropleth in mapping circles.
Being here has already opened my eyes to the part of mapping I always ignored: showing change you can watch happen, rather than visualizing it. With high resolution satellites, I’ve seen earthquakes in Haiti bring about erosion on land. I’ve seen corals bleach in warming waters.
It takes hours to find the change, and even more time to find the exact set of coordinates and time that shows the change, but the satellites are always watching, and they have an almost limitless archive of geocoded maps to dig into. All it takes is the motivation to keep digging.
And with so many untold stories — specifically, science stories — in the satellite space, I won’t stop digging anytime soon.
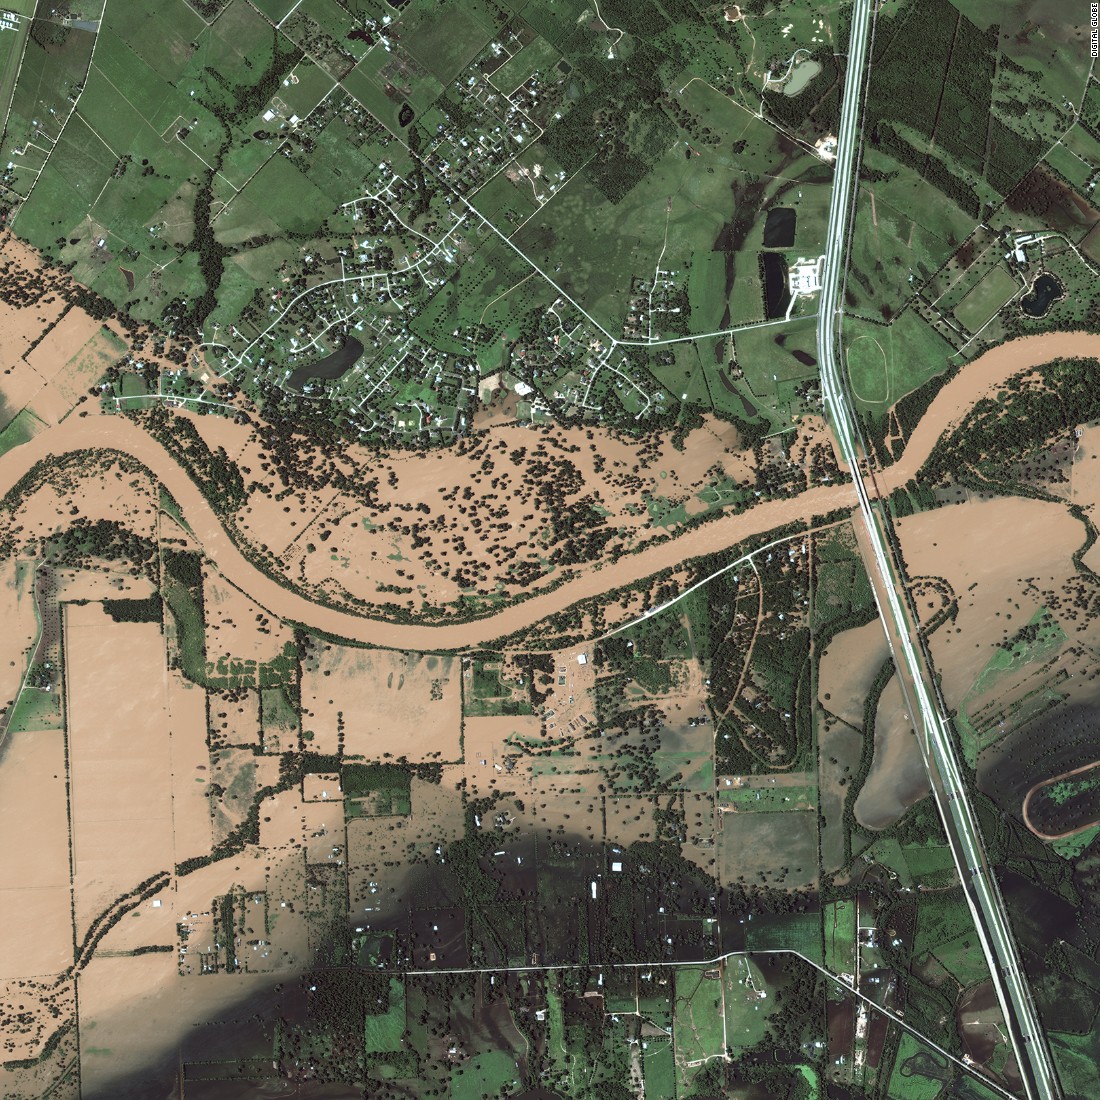
Photo at top: Southeastern Texas was inundated by Hurricane Harvey flood waters in 2017. DigitalGlobe gave high-resolution satellite imagery to scientists and relief workers. (DigitalGlobe)
