
By Eric Burgher
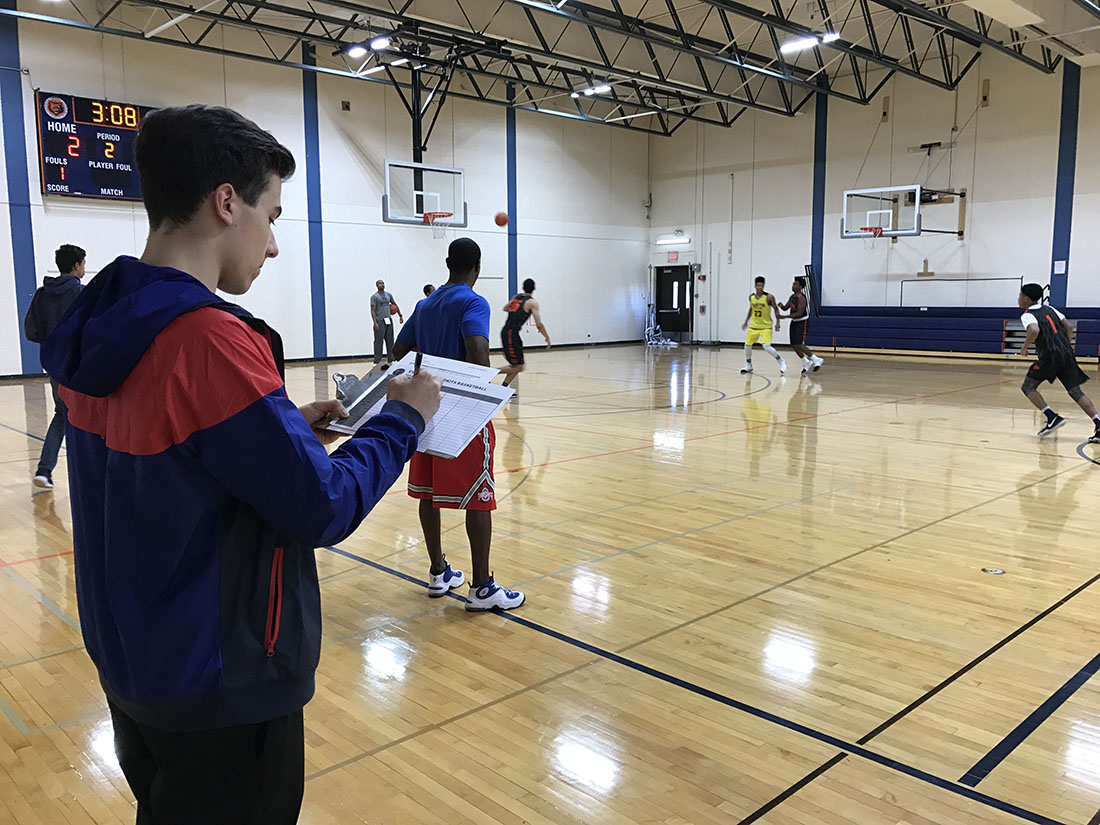
Wearing a gold jersey and gold shorts, Nojel Eastern stood out at a recent Evanston High School basketball practice. And not just because the senior and future Purdue Boilermaker is an ESPN Top 100 recruit.
While the rest of the team was dressed in the Wildkits’ black and orange practice uniforms, Eastern sported the gear given to the player with the best practice stats each week.
Although statistics have long played a role in basketball, the movement toward analytic technology has changed the way high school coaches and players view the game. But coaches are still learning how best to use this information, and a debate has begun regarding how much analytics should be used in high school basketball in Illinois.
At Evanston, with the help of four student assistants, head coach Mike Ellis keeps stats on each drill in practice, tracking everything from made and missed shots to deflections and drawn fouls.
“We try to use that to be competitive and to take ownership over everything we do,” Eastern said. “Everyone wants to be number one on stats and holding other people accountable by using this gold jersey is helpful for the game.”
In addition to keeping stats by hand each practice, the team also subscribes to a service called Hudl, which compiles the numbers each game from video footage and allows players isolated access to all their plays and advanced statistics during the season.
“It’s about repetition and knowing what you can do,” said Evanston senior Elyjah Williams, who uses the software at home after every game. “And those stats being available to us and having that type of access to these games is perfect for us because then we’ll be able to know what our strengths are even more [and] try to work on our weaknesses. That’s something all basketball players need to do, but having those extra resources definitely helps.”
The analytics craze exploded in professional sports with the rise of Billy Beane and “Moneyball” in the early 2000s. And starting in 2010, the NBA introduced SportVU, a system developed by Stats Inc. that uses player and ball tracking to compile comprehensive data. After its early success, SportVU became the official league feed of the NBA in 2013 and began moving into Division I basketball in 2014.
When Houston Rockets general manager Daryl Morey was with the Boston Celtics, part of his job as senior vice president of operations was to develop analytical methods and technology for basketball decisions in areas such as scouting, trades, free agency and the draft. When the Rockets hired Morey as general manager in 2007, they were the first team with a GM who focused primarily on advanced statistical analysis.
And Morey believes that type of analysis has the potential to work in high school basketball as well.
“It will make a big impact,” Morey said. “I’m surprised it’s taken so long, probably because things trickle down maybe a little bit. There’s more opportunity in high school to experiment generally.”
One of the ways high schools have started to experiment is by implementing new technologies, primarily using software developed by competing companies Hudl and Krossover to keep track of advanced statistics through video.
“In 2009, coaches were starting to realize the old-school method of coaching on gut feel was not the way forward and they needed a way to tabulate this and make better decisions,” said Krossover founder Vasu Kulkarni.
After graduating from Penn where Kulkarni was a JV basketball walk-on, he started talking to high school coaches in the state and said he found few who knew how to gather and make sense of data and then implement changes on the court.
Using game film submitted by the schools, Krossover breaks down statistics from the simple – scoring, rebounding, assists, steals and blocks – to the complex, such as field goal efficiency and points per possession from nearly every spot on the court.
Niles West coach Bob Williams, also the school’s director of mathematics, started using Krossover three years ago.
“Being a math guy, I’ve always paid attention to stats as much as I can,” Williams said. “[Krossover] gave me information much more readily and allowed me to use it as evidence with students. Sometimes when you talk to players, they think coach is just getting on them but when they see numbers, they can see the data behind it.”
Williams uses Krossover’s shot charts to see which offensive sets get his team the most open shots. Do they score more in a set offense or on fast breaks? Which shots are the most efficient?
“It informs you as to your strengths and weaknesses, what things to work on and talk about,” he said. “If you’re turning the ball over too much, you need to look at how that is happening.”
But some coaches still haven’t crossed over into stat-based decision-making, even some of the most successful ones. New Trier coach Scott Fricke, with a career winning percentage over .700 entering this season, still relies on the old-school “gut feel” that Kulkarni referred to.
“We look at it but I’m personally not a huge stat guy,” said Fricke, who subscribes to Hudl but primarily for scouting, using its video component. “I’m aware of it, but sometimes stats are a little deceiving so I play it more by what I’m seeing going on in practice and in games.”
Meanwhile, there are still those who are learning how to manage an overwhelming amount of data. Pat Ambrose, Stevenson coach for the last 18 years, uses Krossover and Hudl, but said he is still learning how best to apply all the data now available to him.
“It’s taken away some work [and] it’s given us more information, which sometimes can be information overload,” Ambrose said. “Looking at data and digesting that information and synthesizing it is still a challenge.”
And the advances in statistical technology haven’t produced overwhelmingly positive results for everyone. Tony Lavorato, in his 19th season as coach and math teacher at Maine South, subscribed to both Hudl and Krossover after the products were pitched to him as a way to increase wins.
“Everybody’s looking for an edge to better a program or better themselves,” Lavorato said. “So if there’s a way to do what I’m doing better and more efficiently and help my players be successful, I’m going to do it.”
But after using Hudl for five years and Krossover for two, Lavorato didn’t see a dramatic improvement.
Lavorato’s father coached in Princeton, Ill. for 28 years in the 70s and 80s when game tape was taken on 8mm video and his son still prefers to do everything by hand. His assistant coaches keep stats for each game on an Excel spreadsheet, assigning their own point values for different stats. Players earn one point for a made shot, minus one for a missed shot. An assist is plus two, a turnover is minus two.
For Lavorato, the technology itself does not alone make a successful program.
“You can have all the stats in the world but if you don’t know how to use it or have philosophy how to use it, its counterproductive,” Lavorato said. “And that’s what coaches are trying to figure out.”
And the use of analytics isn’t just restricted to what happens on the court. There is disagreement between coaches and the Illinois High School Association about using advanced stats like strength of schedule to determine postseason seeding.
The IHSA determines seeding by head-to-head victories, record against common opponents, total win-loss record and a team evaluation based on narratives provided by the coaches.
“While I understand there’s an interest level to that analytic structure, it takes away from what the high school game should be,” said IHSA associate executive director Kurt Gibson. “In the college or pro game, it makes sense but high school remains different. When we bring those more advanced models into the high school program, it diminishes a more pure program.”
But coaches say factors like strength of schedule are important when considering who their teams will face in the postseason. An additional source coaches use is the Essig Report, an independent computer program devised by 86-year-old former West Aurora High School athlete Charlie Essig, which measures comparative strength of high school teams in Illinois based on game performances versus strength of schedule.
“When you get down to two teams with similar wins and losses, it’s only logical to consider who those wins were against and who were those losses against,” said Ellis. “You can’t have a perfect world of head-to-head match-ups. I take the criteria of the IHSA and if I’ve gone through those steps and can’t figure out who seeds higher, I see who has a tougher schedule.”
Gibson said the IHSA would consider adjusting its protocol, but only if there was a strong push from the schools, which he says has not yet happened.
One way or another, advanced analytics are quickly finding a home in high school basketball, and it appears this is only be the beginning.
“In five years, a kid won’t play on a team unless it’s guaranteed he can come back home, log in on a mobile device and have a full breakdown of everything he did,” Kulkarni said. “All of it is going to become standard.”
